Indigenous peoples make up approximately 5% of the total Canadian population. Under the Canadian Constitution, they are recognized as “Aboriginal,” although the term indigenous is preferred, and consist of three groups: First Nations (approximate population in 2016: 977,000), Métis (about 587,000) and Inuit (about 65,000).1
The cancer burden among First Nations, Inuit and Métis (FNIM) peoples in Canada is significant. Although Canada is a high-income country with a universal healthcare system, a recent national study demonstrated poorer survival among First Nations peoples compared with non-Aboriginals for 14 of 15 of the most common cancers.2 In the province of British Columbia, poorer survival was observed among First Nations vs non-First Nations peoples in 10 of 15 cancer sites studied in women, and 10 of 12 cancer sites studied in men.3 Similar findings have been reported for First Nations peoples with head and neck cancers in the province of Alberta,4 across multiple cancer types in the province of Ontario,5 and for Métis adults with prostate cancer nationally.6 In addition, all-cancer age-standardized mortality rates among the Inuit Nunangat (“homelands”) have been consistently higher compared to national rates from 1994 to 2013.7
One reason underpinning the observed disparities in cancer outcomes between indigenous and non-indigenous populations is the poorer access to, or uptake of, cancer treatments once diagnosed, including radiation therapy (RT).8-10 The barriers to accessing cancer services among indigenous peoples are multifactorial, and include mistrust of the health system, stigma, and a lack of cultural understanding within the health system,11 stemming from complex sociohistorical factors.8
Among such barriers, distance and the resulting travel burden have repeatedly shown significant impact on access to cancer services in the general population, negatively influencing all aspects of a patient’s cancer journey from stage at diagnosis to quality of life.12 RT is no exception to this and, in fact, a longer distance from place of residence to an RT center has been cited as one of the most important barriers to accessing this treatment.13 Increasing distance to RT has also been associated with decreased RT utilization,14,15 but its association with cancer outcomes has not yet been explored among indigenous peoples in Canada. We sought to describe geographic access to RT as measured by distance (health region to the nearest RT center), and to determine the association of distance to RT with cancer outcomes among regions inhabited by a higher proportion of FNIM peoples.
Methods and Materials
Data sources and Definitions
Distance to Radiation Therapy Center
We extracted the geographic locations of each Canadian RT center from The Directory of Radiotherapy Centers, an online international registry maintained by the Division of Human Health at the International Atomic Energy Agency (IAEA).16 We supplemented this with data from the Canadian Association of Radiation Oncology. For this study, we included only RT centers that were operational in 2012 to most closely match the time period of our cancer outcomes data.
We mapped all health regions in Canada using data from Statistics Canada,17 and an open-source geographic information systems (GIS) suite (QGIS v.2.18). Health regions are administrative areas based on geographical or operational boundaries, that are one level below provinces in Canada.18 They provide the most granular level for which cancer data are consistently available across the country. The central geographic point (centroid) of each health region was auto-calculated. The linear distance, in kilometers, from each health region centroid to the nearest RT center was measured irrespective of provincial boundaries, as Canadians can access RT at any center regardless of home province affiliation.
Population of Interest
As a proxy to explore access to RT among FNIM peoples in Canada, we extracted information on the proportion of FNIM peoples per health region. Data were obtained from the 2011 National Household Survey (NHS), a voluntary survey sampling 30% of all private dwellings in Canada that were part of the national census.19 Populations including FNIM were oversampled to improve response rates.20 Proportion of FNIM peoples was based on the proportion of self-identified Aboriginals per health region. Aboriginal identity included persons who self-reported being an Aboriginal person, including First Nations (North American Indian), Métis, or Inuk (Inuit) and/or those who reported Registered or Treaty Indian status, and/or those who reported membership in a First Nation or Indian band.21
Sociodemographic Variables
To explore the influence of other factors, we extracted data on food security and smoking, which in our previous work, were found to be significantly associated with our cancer outcomes data among the general Canadian population (Chan, submitted). Both variables were obtained from the 2011-2012 Canadian Community Health Survey (CCHS),22,23 a voluntary survey administered by Statistics Canada that represents more than 97% of the Canadian population ages ≥ 12, but excludes persons living in the Québec health regions of Région du Nunavik and Région des Terres-Cries-de-la-Baie-James, and persons living on reserves and other Aboriginal settlements in the provinces.24 Definitions for food-secure households were based on the CCHS Food Security module, which included questions such as not being able to afford balanced meals, being hungry but not eating, and not eating for the whole day.25 Smoking was defined as the proportion of daily or occasional daily smokers.22 Other sociodemographic variables were not included due to high multi-collinearity with the proportion of FNIM variable.
Mortality-to-incidence Ratios
Age-standardized all-cancer incidence and mortality rates were obtained for each health region from Statistics Canada, which were available in three-year aggregates and based on provincial registry data.26,27 We used the most recent data (2010-2012) for all provinces and territories, except for Québec, where the most recent incidence data was from 2008-2010. Incidence and mortality rates were age-standardized using the 2011 Canadian Census population. All-cancer age-standardized mortality-to-incidence ratios (MIRs) were calculated for each health region as the mortality rate divided by incidence rate.
Statistical Analyses
We conducted two recursive partitioning analyses (RPA) to define cut-offs for our variables and to explore relationships between them. RPA is a method used to classify subjects and variables, and can be useful in identifying synergistic interactions among factors.28 In the medical context, it has been useful in determining prognostic and risk groups in patients with cancer, and in creating clinical algorithms for patient treatment.29,30 The order in which independent variables are partitioned indicates its impact on the dependent variable; the earlier it is partitioned, the higher the impact.31 First, as an initial exploratory analysis, we used RPA to categorize the proportion of FNIM variable into two groups (regions with a high vs low proportion of FNIM peoples). We then conducted nonparametric tests to compare distance and MIR between the two groups. Second, we used RPA to create a prediction model, with a proportion of FNIM people, distance, smoking and food security as the independent variables, and MIR as the dependent variable. The RPA algorithm created cut-offs and separated these variables into several groups. These were compared using nonparametric tests (Wilcoxon tests for independent samples) due to small sample sizes. Effect sizes for nonparametric tests were estimated,32 with r values of 0.1 indicating a small, 0.3 medium and 0.5 large effect.33
All statistical tests were conducted with JMP v.12. Choropleth maps were generated using Tableau v.10.4.
Results
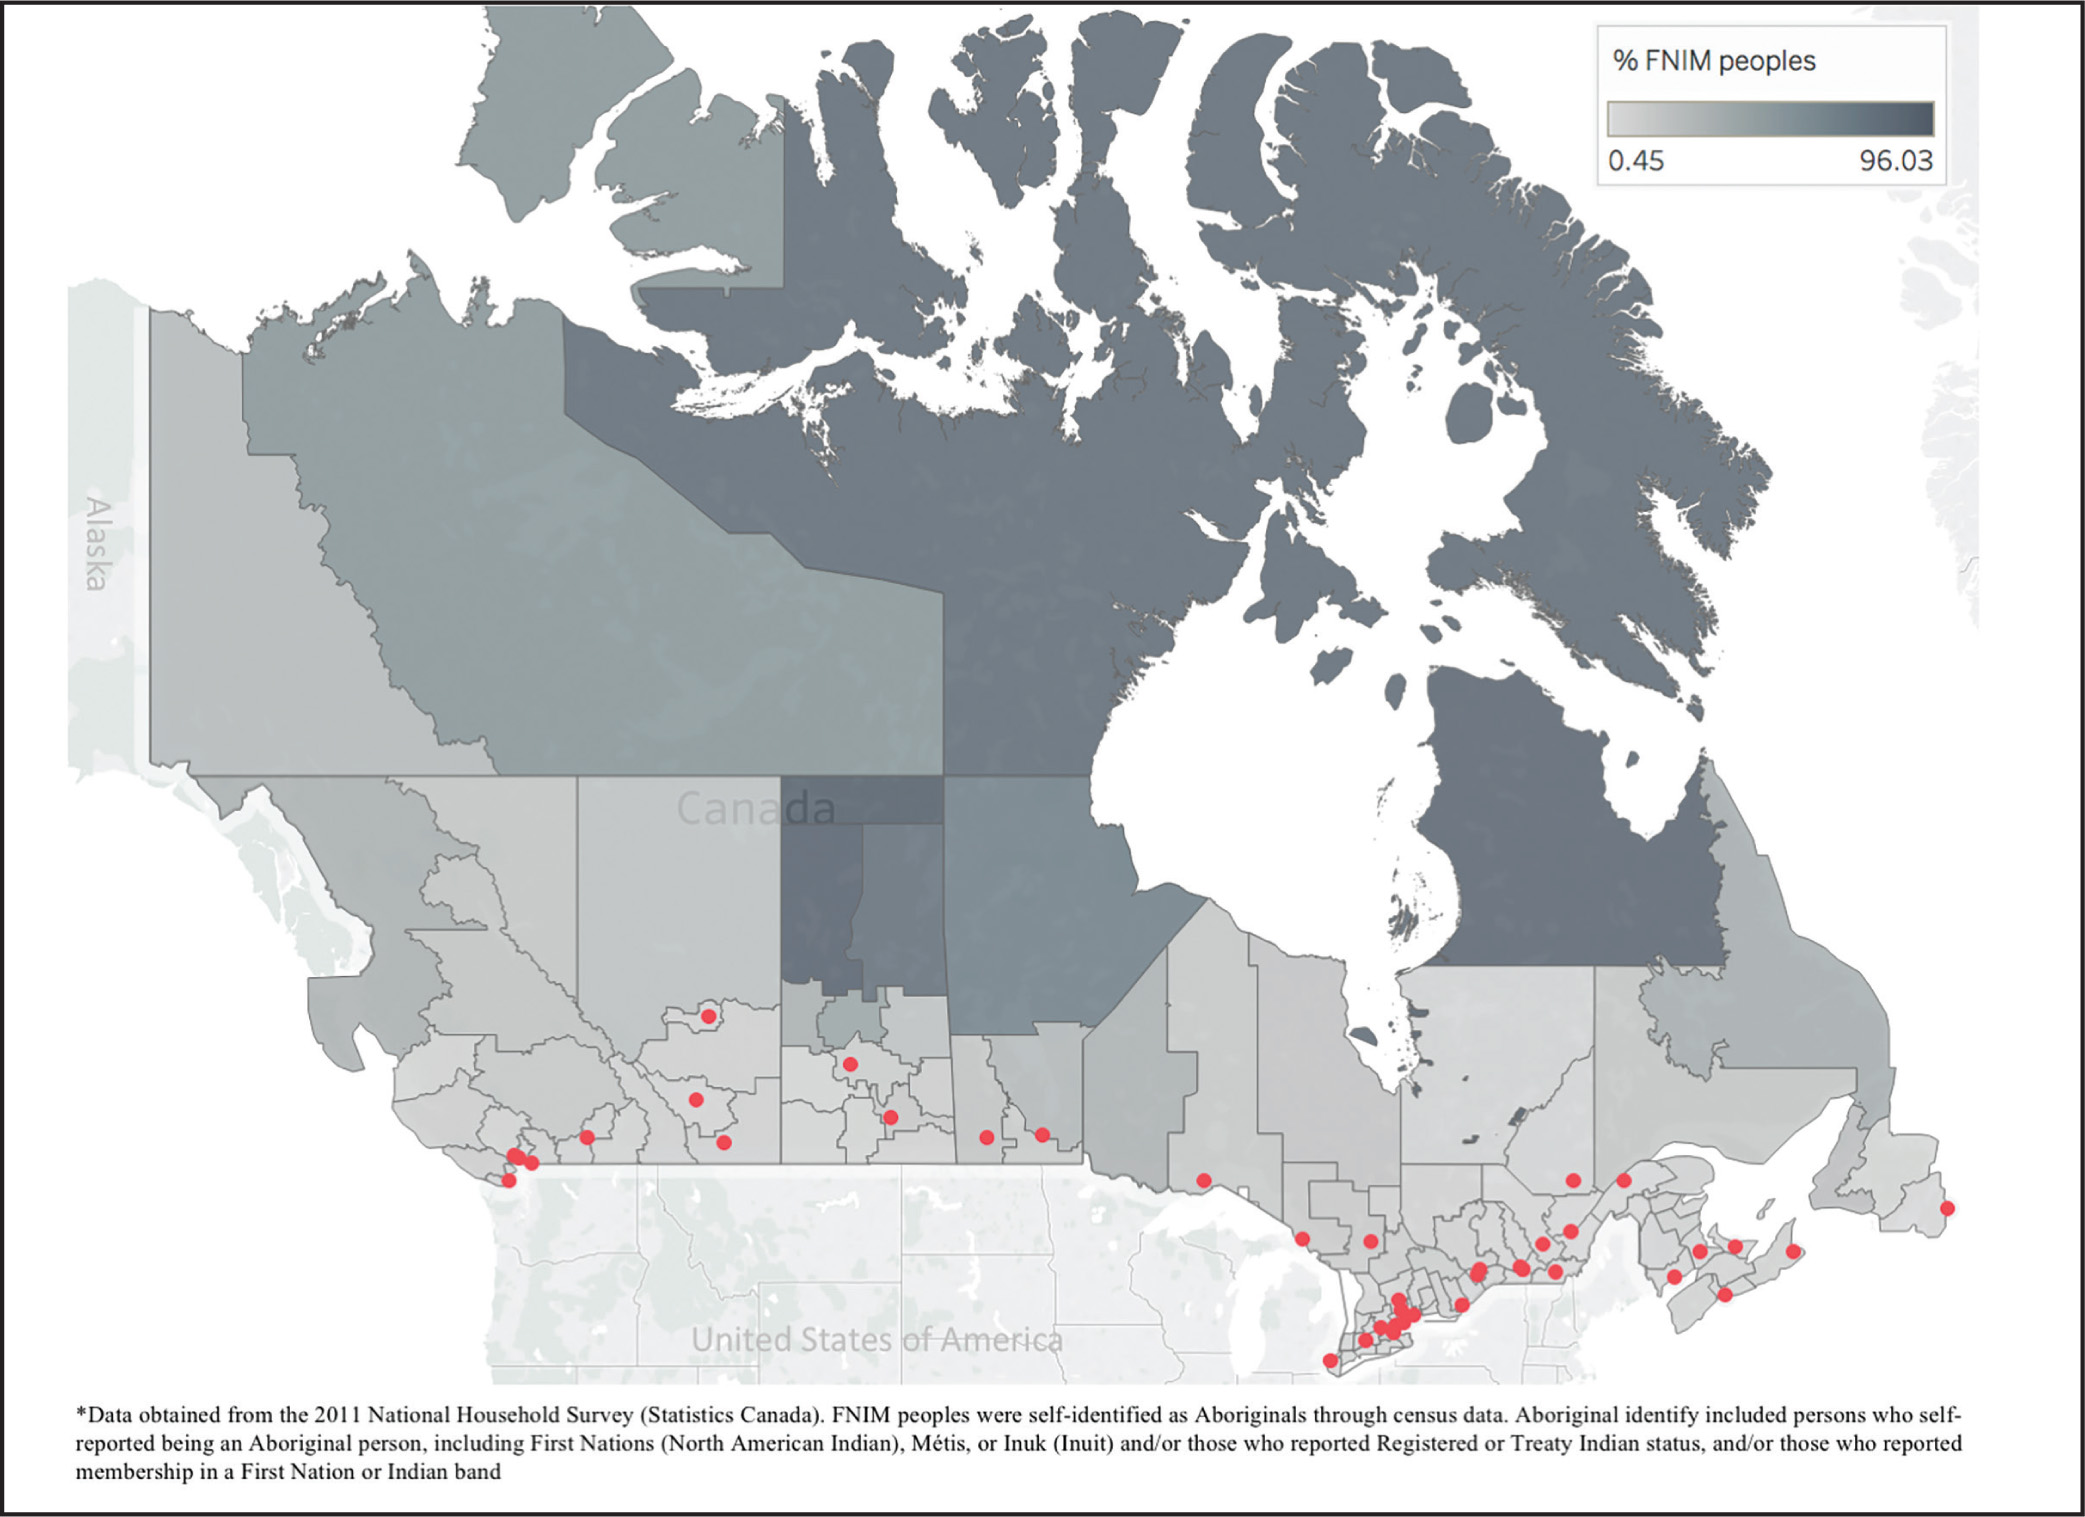
Across the 112 health regions in Canada, the median linear distance from health region centroid to nearest RT center was 102 km, with 50% (56/112) of health regions more than 100 km from an RT center. The closest distance was from British Columbia’s Vancouver Health Service Delivery Area (1 km), and the largest distance was from Nunavut (2,095 km). Ontario’s York Regional Health Unit had the lowest proportion of FNIM peoples at 0.4%, and the highest proportion was in Québec’s Région des Terres-Cries-de-la-Baie-James at 96%. Nearly all RT centers were in the south of the country, far from health regions with the highest proportion of FNIM peoples (Figure 1). Indeed, 83% of health regions with a FNIM population of 30% or more (the 90th percentile) were 500 km or further from the nearest RT center.
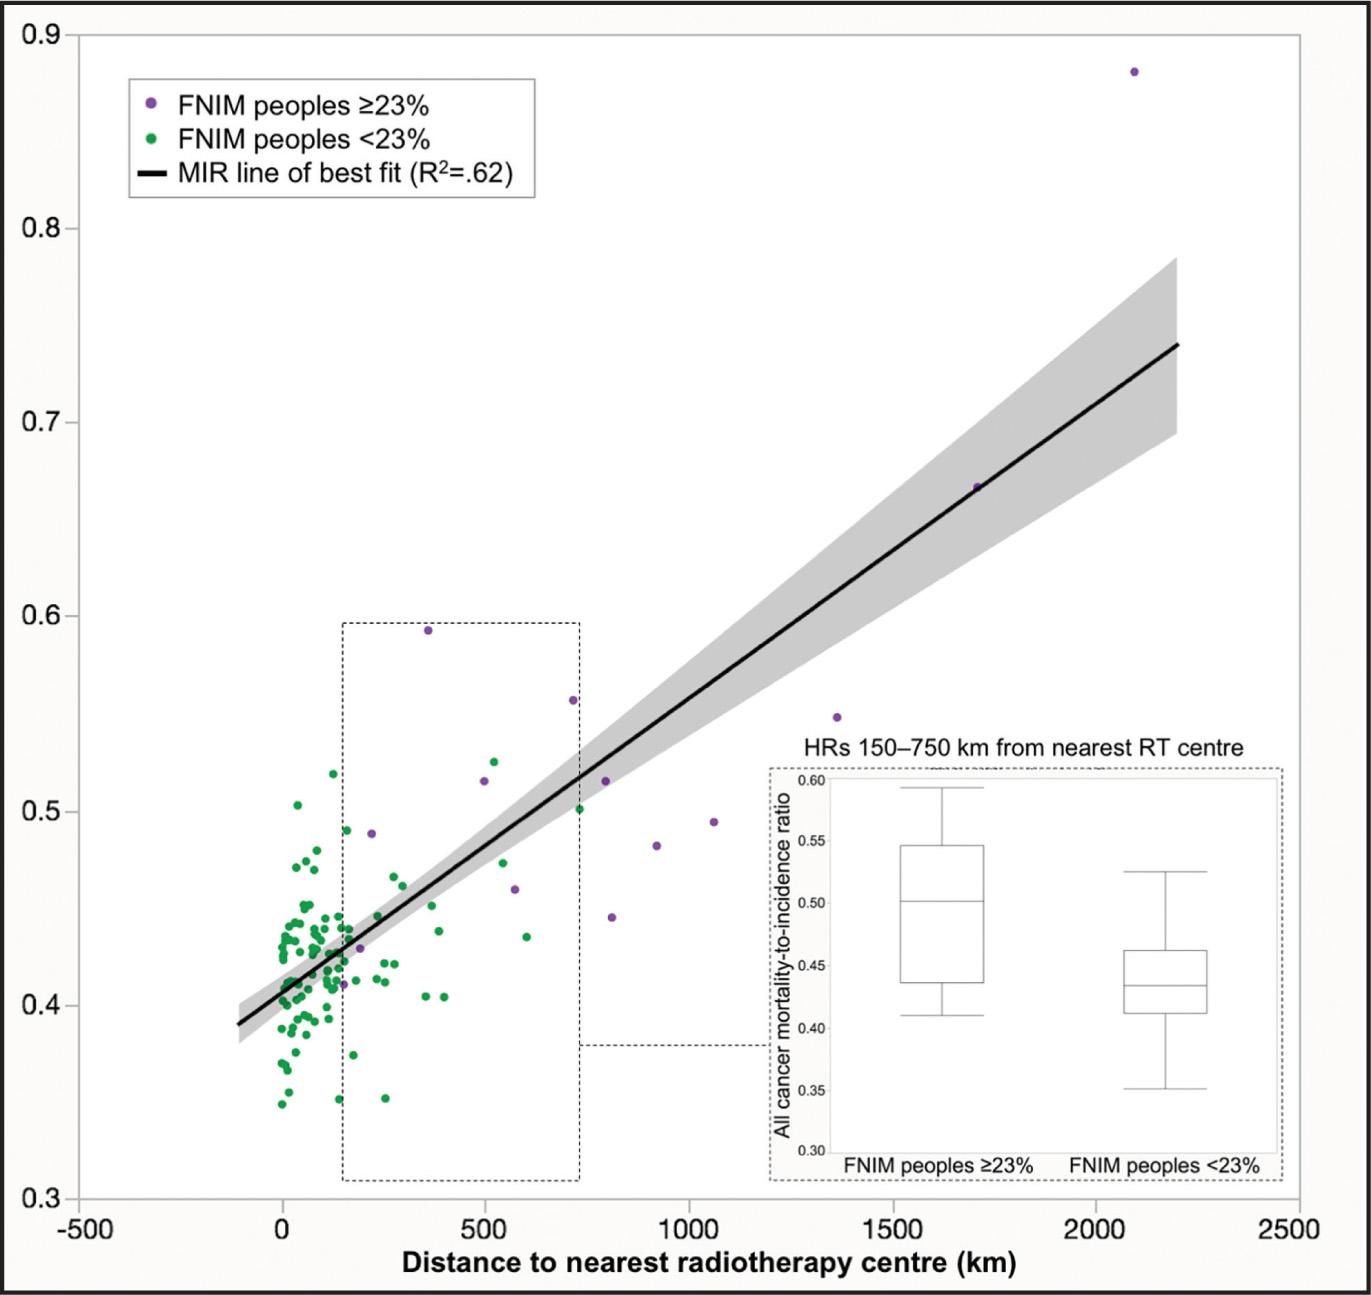
Our first partitioning analysis of the proportion of FNIM variable created two groups: regions with a high (≥ 23%) and low (< 23%) proportion of FNIM peoples. Distance to nearest RT center was significantly further for regions with a high vs low proportion of FNIM peoples (799 vs 120 km, Z = 5.60, p < .0001). Regions with a high proportion of FNIM peoples also exhibited worse cancer outcomes (MIR 0.53 vs 0.42, Z = 4.89, p < .0001). Distance explained 62% of the variability in MIR (r2 = 0.62). We also examined a subgroup of health regions that overlapped in distance (those within 150-750 km from nearest RT center); regions with a high proportion of FNIM peoples still had significantly worse outcomes compared to those with a low proportion of FNIM peoples (MIR 0.50 vs 0.44, p =.03), despite no difference in distance (p =.47) (Figure 2).
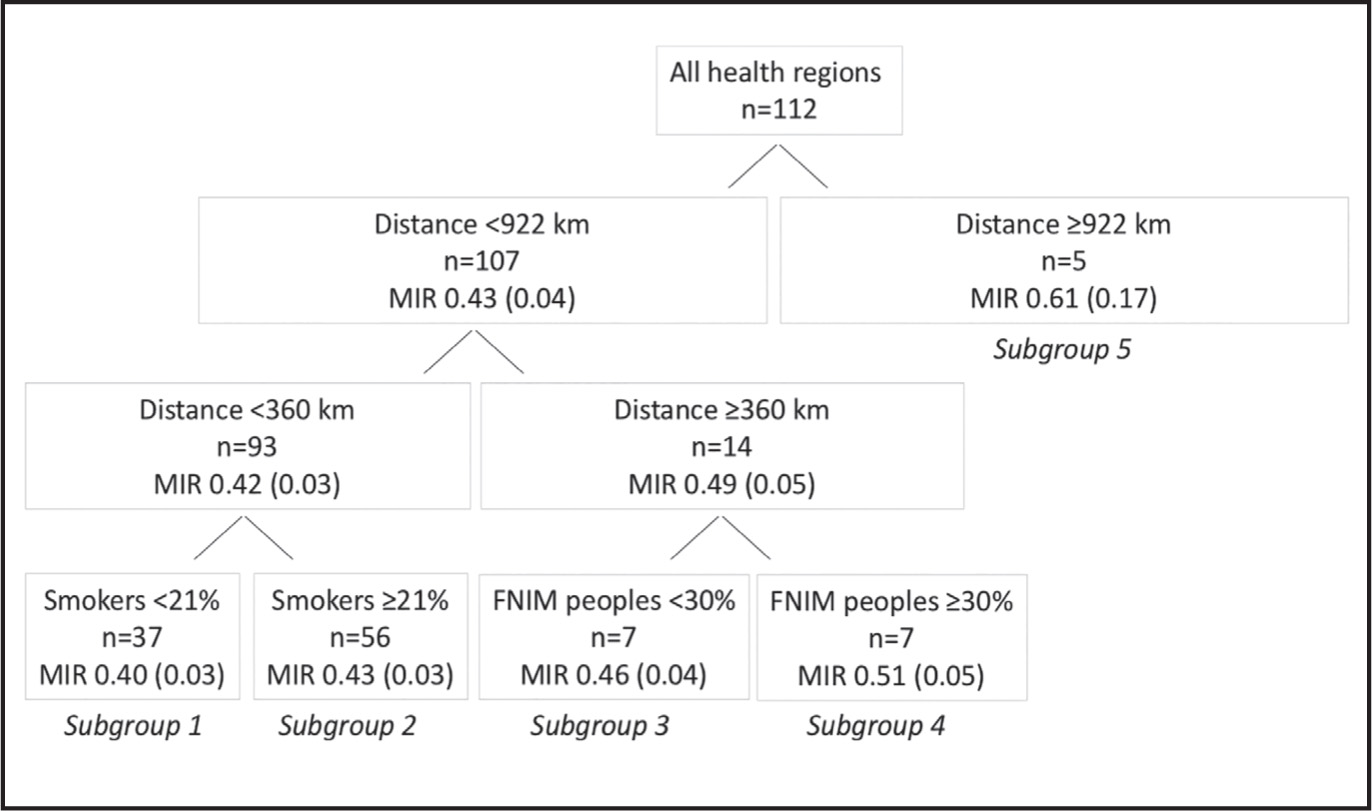
In our second partitioning analysis to generate a prediction model including smoking and food security, distance to nearest RT center was partitioned first (< 922 vs ≥ 922 km), indicating that it was the most influential variable on MIR (Figure 3). This was followed equally by smoking and proportion of FNIM peoples, but not food security. Following the creation of five subgroups in the model, the iteration was terminated, as further partitions were not possible due to small sample sizes within the subgroups, or because further iterations continued to partition the smoking variable into smaller categories, which was felt not to be clinically meaningful.
The resulting five subgroups are shown in Figure 3. Regions furthest from RT centers (≥ 922 km) had the poorest outcomes (MIR 0.61) (Table 1). However, regions closer to an RT center (360-921 km) but with a higher proportion of FNIM peoples had poor outcomes that did not differ from regions furthest away (MIR 0.51; p = .41), while also displaying a trend toward worse outcomes compared to regions within the same distance but with a lower proportion of FNIM peoples (MIR 0.46, p = .07). The best outcomes were seen among regions closest to an RT center (< 360 km) and with a lower vs higher proportion of smokers (MIRs 0.40 vs 0.43; p < .01).
| Subgroup | Description | Mean MIRs | Z-score | p-value | Effect size (r) |
|---|---|---|---|---|---|
| 5 vs 1 | Distance ≥ 922 km vs Distance < 360 km and Smokers < 21% | .61 vs .40 | 3.57 | <. 01 | 0.55 |
| 5 vs 2 | Distance ≥ 922 km vs Distance < 360 km and Smokers ≥ 21% | .61 vs .43 | 3.51 | <. 01 | 0.45 |
| 5 vs 3 | Distance ≥ 922 km vs Distance 360-921 km and FNIM peoples < 30% | .61 vs .46 | 2.11 | 0.03 | 0.61 |
| 5 vs 4 | Distance ≥ 922 km vs Distance 360-921 km and FNIM peoples ≥ 30% | .61 vs .51 | 0.82 | 0.41 | 0.24 |
| 1 vs 2 | Distance < 360 km: Smokers < 21% vs Smokers ≥ 21% | .40 vs .43 | -4.24 | <. 01 | 0.44 |
| 3 vs 4 | Distance 360-921 km: FNIM peoples < 30% vs FNIM peoples ≥ 30% | .46 vs .51 | -1.8 | 0.07 | 0.48 |
Discussion
Despite living in a high-income country with a universal healthcare system, indigenous peoples in Canada experience significantly higher cancer mortality compared to the general population. As RT has a population benefit on survival when optimally used,34 we sought to describe geographic access to RT among indigenous peoples in Canada using GIS techniques, and to explore its association with cancer outcomes.
In our study, regions inhabited by a higher proportion of FNIM peoples had significantly poorer geographic access to RT, as measured by distance. This is consistent with the known geographic distribution of FNIM peoples in Canada, where nearly 40% of these populations live in a rural area,35 far from RT centers, which are typically in large urban centers.
Distance to RT was the most important factor influencing MIRs in our model, and has been similarly associated with poorer cancer outcomes among rectal cancer patients in Australia, where for every 100 km increase in distance to RT, there was a 6% mortality increase.36 Notably, however, distance did not entirely explain the observed poorer MIRs, as health regions within a similar distance to RT centers still had worse outcomes if inhabited by a larger proportion of FNIM peoples. Similar findings were reported in a national study describing cancer survival between First Nations and non-Aboriginal peoples in Canada, where rurality had little impact on the observed disparities between these two groups,2 and an international meta-analysis on indigenous mortality by rurality indicated no difference in all-cancer mortality between urban and rural areas.37 Therefore, FNIM peoples populations may still experience worse cancer outcomes despite being closer to cancer services, including RT.
Other reasons that may contribute to the poorer cancer outcomes observed in our study include smoking, which has a well-established link to cancer mortality with approximately 80% of lung cancer deaths in Canada attributed to cigarette smoking.38 Conversely, food security was not found to be as influential on MIRs as distance, smoking or the proportion of FNIM peoples per health region. There is a high prevalence of food insecurity among indigenous populations in Canada,39 which in Ontario has been shown to persist regardless of geography.40 In addition, the food security variable was obtained from the CCHS, which may not be measuring food insecurity in an indigenous context, and excludes data from on-reserve populations across Canada and two health regions in Québec with a high proportion of indigenous peoples. For these reasons, food security may still be associated with MIR but may not have been measured well enough to produce an effect in our analyses.
Limitations of our study include its ecological design, providing only a high-level description of the current state of RT access, the distribution of FNIM people across Canada, and their associations with cancer outcomes. By grouping large geographic areas that also contain semi-urban centers inhabited by a low proportion of FNIM peoples, we are potentially underestimating the impact of this variable’s influence on outcomes. In addition, we were unable to control for other important confounding factors that may influence MIR, including stage distribution and access to cancer surgery. Our sample sizes of health regions were also small in some of the subgroup analyses.
Conclusion
In conclusion, regions inhabited by a higher proportion of indigenous peoples demonstrate poorer geographic access to RT and worse cancer outcomes in Canada. Approaches to improve such disparities in cancer outcomes are required that address the entire spectrum from prevention and diagnosis to treatment, and require further exploration. These may include culturally appropriate health promotion programs, and the hypofractionation of radiation treatments, while incorporating strategies to improve geographic access, including telemedicine and strengthening existing transportation programs. As the lack of indigenous-specific identifiers in many of the country’s health data sources continues to be a challenge,41 our study provides important data in describing access to cancer services and its association with outcomes on a national level, as a first step in striving toward equitable healthcare delivery for FNIM peoples.